

LFLOW. PRESSURE DROP CALCULATION SOFTWARE
The fittings can be selected from the database or the user can enter manually the values ​​of loss coefficient or flow coefficient.
The calculation of the pressure drop in a pipe, including the so-called minor losses or losses in fittings , usually involves a number of estimations, as all the required information is often not available at the moment of design, at least accurately. For example, the flow rate is often not known with accuracy when designing an installation as it depends on the operating point of the pump , pressure loss in the installation and the actual pump curve that finally will be installed . In addition , there are elements that produce a variable pressure loss, not only valves , but also others like filters whose head loss depends on the level of clogging. This is just an example to highlight the difficulty of accurately estimating many parameters of the system and that it is important to have a tool to make a quick assessment of up to what extent these inaccuracies can be really relevant.
The following chart shows how the pipe diameter affects the pressure drop:
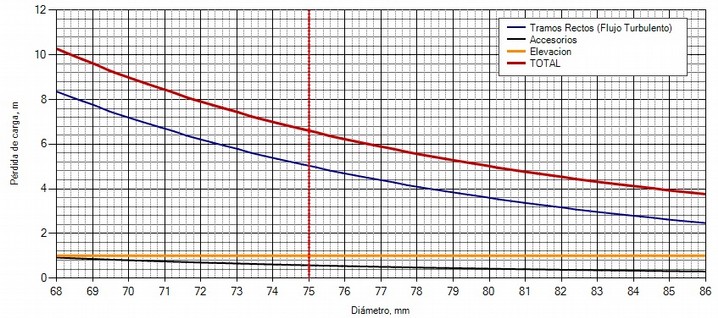
Using the above curves, the pipe diameter can be sectected inmediately. The curves show that the main cause of the pressure difference between the inlet and outlet of the installation is due to the loss in straight runs (blue curve). The head loss in fittings (black curve) is small and varies slightly when changing the diameter. Yellow curve is due to the difference in height between the inlet and outlet and has a constant value equal to the difference of the liquid column.
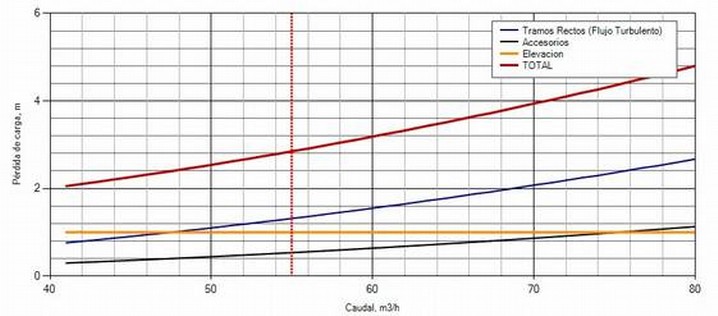
In the following example the pressure loss is shown against variations of flow rate:
FACTORS AFFECTING PRESSURE DROP CALCULATION :
Changes in flow rate.
discussed aboveChanges in roughness .
The roughness of a pipe is difficult to determine a priori , especially considering that different bibliography and papers provide different values ​​for the same type of material. Ideally we should use the values ​​provided by the pipe manufacturer, but this is not always possible or sometimes this information is not available. Besides the roughness value is not constant throughout the life of the pipeline as both corrosion and fouling can occur.Changes in viscosity.
The viscosity of a liquid is dependent on temperature. Therefore, it is expected that the fluid will have different viscosities depending on the temperature of the line, which can in turn be affected in some cases by the ambient temperature. Sometimes the same installation can work with fluids of different characteristics and therefore there will be viscosity changes. Other times these variations are not very important , but in any case it is important to see how they actually affect the calculations and be able to obtain reports of how this factor contributes to the total uncertainty of the calculations. The viscosity affects the value of the Reynolds number inversely , which also produce a change in the friction factorPressure Losses in fittings.
They are sometimes also called minor losses since in many cases are small and can even be neglected. Its accurate calculation may be difficult because it depends on the exact details of each manufacturer. Usually they are characterized by the loss coefficient ( K ) . As this coefficient depends on the actual geometry of the fitting, fittings from different manufacturers can have different loss coefficients. For components like valves, filters etc , manufacturers usually provide the value of Kv or Cv (flow coefficient).Our recommendation is that if it is possible you should enter into the LFlow application the K , Kv or Cv values ​​provided by the manufacturers as this is the way to get more accurate values​​. However, this information sometimes is not available for many fittings as elbows , reducers , tees, etc., so it will have to be used the database. The database calculates the loss coefficient for the selected diameter. Using this fittings database has an important advantage, that is the possibility of obtaining a graph showing how the pressure loss changes for different diameters. This is of great interest when designing the installation as it helps for the selection of the diameter of the line. It should be taken as an estimatation since these values ​​have been determined empirically and reflected in different literature and standards, but because of its dependence on factors such as the exact geometry of the element and its diameter, different sources show different values ​​for the same type of fitting. However, as mentioned earlier, in many cases these losses may even be negligible, especially for very long pipes with relatively few accessories. In these cases , the uncertainty introduced will not be relevant.
Transition between laminar flow and turbulent flow.
This software performs calculations for both laminar flow ( Reynolds number (Re) < 2000 ) , and for turbulent flow ( Re > 4000 ) . The critical zone or transition zone is the one in which the Reynolds number is between the values ​2000 and 4000 . In this area, it is impossible to predict the behaviour of the flow, i.e. whether it will be laminar or turbulent , and therefore to know the pressure drop . This implies a discontinuity in the calculations since the formulas used for the friction factor are different depending on the type of flow. The software LFlow solves this problem by estimating the friction factor for this critical area, so that a continuity is achieved in the graphs from the zone of turbulent flow to laminar flow. Additionally , the graphs show the pressure drop in both cases: considering laminar flow and turbulent flow. The estimated pressure drop will always be between both values ​​: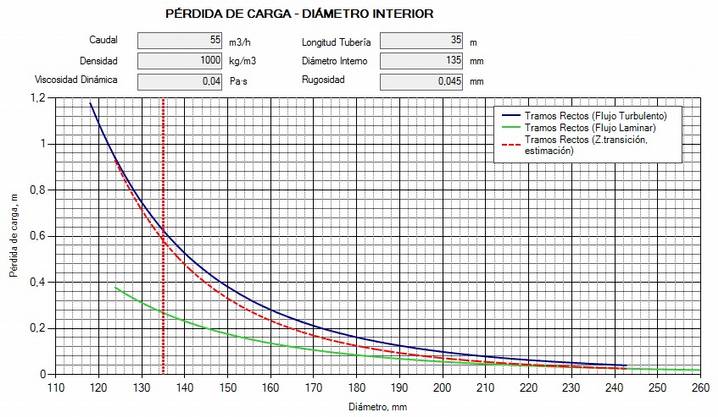
In practice, most of the installations work with turbulent flows.
FAQ:
How can I calculate the actual operating point of a pump using LFlow software?
L Flow can show a chart for pressure drop as a function of flow rate. This chart includes curves for pressure loss in straight pipe run, pressure loss in fittings and difference in pressure due to elevation. You can compare this curves with the pump curve to see the actual operating point
Can I enter all the data in different units?
Yes, the software allow the user for most of the paramenters to select between different engineering units.
Can I print out a report with the results and curves?
Yes, all the reports show a button for printing.
Can the application be customized so it exactly fits my specific requirements?
Yes, do not hesitate to contact us and let us know your requirments.
What are the requirements that my computer should have to install LFlow?
You will need to have installed .NET Framework 4 from Microsoft o any compatible version. This software comes installed by default with Vista, Windows7, Windows8 and sometimes with Windows XP. In case it is not already installed you can download it for free from the Microsoft website.
------ FOR MORE INFORMATION DO NOT HESITATE TO CONTACT US ------